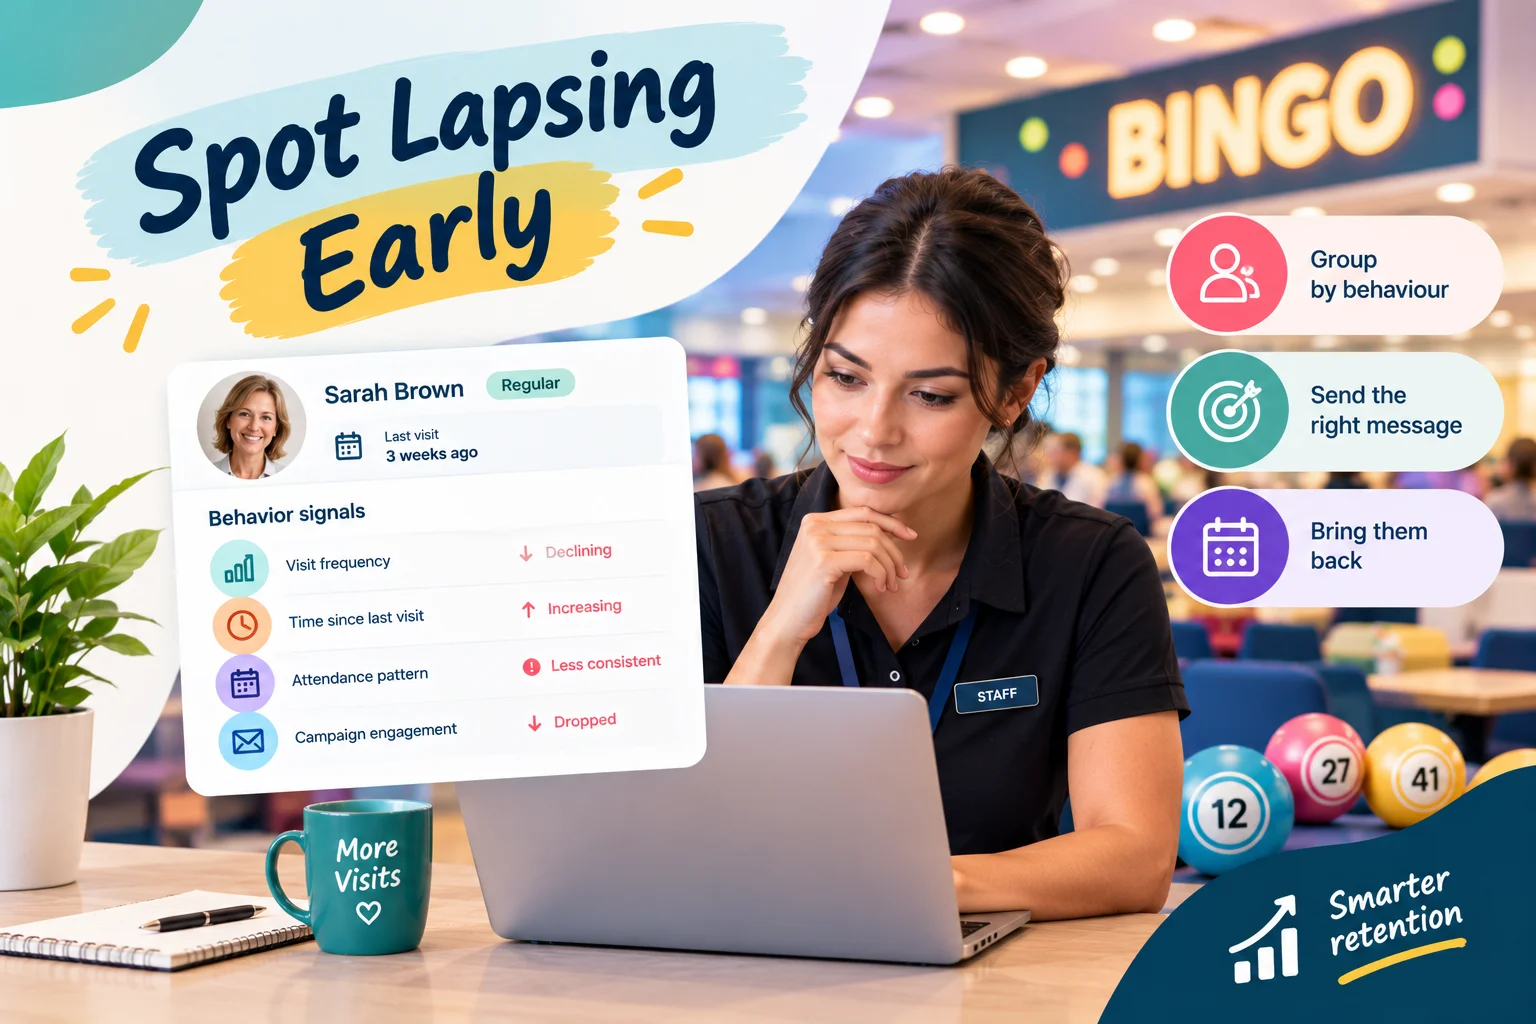
Monday morning is a useful time to ask a simple question: what actually happened at your bingo hall last week?
You know how many sessions took place. You may know which nights were busy and which were quieter. You might also remember sending a promotional message, introducing a reward, or welcoming several new members.
But can you explain which activities produced meaningful results?
Did new players return after their first visit? Did attendance become more consistent? Which campaign generated the strongest response? Were players using the rewards you promoted? And did your contact list become healthier or simply larger?
Without a consistent reporting routine, these questions often lead to guesswork. Operators rely on memory, scattered spreadsheets, and individual campaign reports that are difficult to compare.
An analytics dashboard brings those measurements into a more organised view. However, opening the dashboard is only the first step. The real value comes from knowing what to examine and deciding what to do with the information.
A useful weekly analytics review should turn last week's activity into next week's operating decisions.
This guide explains how bingo hall operators can structure that review, which metrics deserve attention, and how to avoid treating every change in a report as a reason to launch another promotion.
Start With the Weekly Picture, Not an Individual Campaign
Before looking at individual messages or rewards, review the overall position of the hall.
The first few minutes should establish whether the previous week was broadly stable, improving, or showing signs that something needs investigation.
Start with three questions:
- Did the hall attract new members?
- Did existing players maintain their attendance patterns?
- Did marketing and loyalty activity produce the outcomes they were intended to support?
These questions provide a practical framework for the rest of the review.
For example, a week with strong new signups but declining repeat visits may indicate that acquisition is progressing while retention needs attention. A week with stable attendance but falling campaign engagement may suggest that communication needs reviewing rather than the session schedule.
Do not jump straight to a conclusion. First establish what changed, then investigate which metric or audience contributed to it.
The Seven Metrics Every Bingo Hall Should Review Weekly
A dashboard becomes useful when operators know which numbers deserve attention and what decisions those numbers can support.
The following seven areas provide a practical starting point for a weekly review.
1. New Player Signups: Is Your Audience Growing?
New signups show how many people have joined your player database during a particular period.
This is an important growth indicator, especially for halls that use QR registration, kiosk enrollment, or other signup methods to build their contact lists.
However, a growing database does not automatically mean a growing attendance base.
Imagine that your hall records 35 new signups this week, compared with 22 last week. That looks positive, but the next question is whether those new members actually attend and return.
What to review:
- Total new signups during the week.
- Comparison with previous weeks.
- Signup sources, where tracking is available.
- Whether new members have completed the necessary contact and consent information.
- Repeat attendance among recently acquired members.
What to do with the information:
If signups are increasing, examine which acquisition methods are contributing to the growth. If QR registration at a particular event performs well, consider using a similar approach at other suitable sessions.
If signups are strong but repeat visits remain low, review the welcome journey. New members may need useful session information, a clear introduction to the loyalty programme, or a relevant invitation to return.
Do not respond to every signup decline by increasing promotional messages. First investigate whether the issue is event attendance, signup visibility, registration processes, or the number of new visitors.
2. Visit Frequency: Are Players Building Consistent Attendance Habits?
Total attendance tells you how many visits took place. Visit frequency helps you understand how regularly players are returning.
This is one of the most useful measures for a session-based business because it provides context about player relationships over time.
Consider a fictional hall with two groups:
- Group A consists of 40 players who attend regularly throughout the month.
- Group B consists of 40 players who visit occasionally, often around special events.
Both groups contain the same number of people, but their attendance patterns are different.
A weekly review of visit frequency can help operators identify whether the hall is maintaining its established audience and whether occasional visitors are becoming more engaged.
What to review:
- Average visits per player over the selected period.
- Changes in frequency compared with previous periods.
- Players whose attendance has increased or decreased.
- Differences between regular, occasional, and new members.
- Attendance patterns across individual sessions.
What to do with the information:
If regular players are attending less frequently, investigate whether the change is temporary or part of a longer pattern. Check the session calendar, recent promotions, and other operational changes before deciding on a response.
If occasional visitors are becoming more consistent, identify which sessions or engagement activities may be contributing to that pattern.
If frequency is improving, do not automatically assume a particular campaign caused it. Compare the timing of promotions with attendance changes and consider other influences.
The goal is to understand whether attendance habits are strengthening, weakening, or simply changing.
3. Last-Visit Trends: Which Players May Need Attention?
A last-visit report can help identify members who have not attended recently.
But a date by itself does not tell you whether a player is genuinely becoming inactive.
A person who normally visits once a month may be perfectly on schedule after three weeks. Someone who usually attends every Tuesday and Friday may have an unusual gap after missing several sessions.
This is why last-visit information should be reviewed alongside normal attendance frequency.
What to review:
- Players who have not visited within a defined period.
- Changes in last-visit patterns among regular attendees.
- Recently inactive players compared with longer-term lapsed members.
- Whether inactivity is concentrated among particular player groups.
- Whether previously contacted members have returned.
What to do with the information:
Create a review group for players whose attendance has changed meaningfully.
For example, a player who usually attends weekly but has not visited for several weeks may be suitable for a relevant session reminder, provided they can legally and appropriately receive it.
A longer-term inactive member may require a different re-engagement approach.
Avoid sending the same win-back message to everyone. A useful last-visit review helps operators decide who deserves attention and what type of communication is appropriate.
4. Campaign Performance: Which Messages Are Producing Useful Results?
Bingo halls often communicate through SMS, email, and other available channels to promote sessions, events, jackpots, and loyalty offers.
The challenge is not simply sending campaigns. It is understanding what happens after they are sent.
A campaign report may include delivery, engagement, replies, clicks, or other available outcomes. These measures help operators understand whether a message reached its intended audience and attracted attention.
However, a delivered message is not proof of an additional visit.
What to review:
- Number of campaigns sent during the week.
- Delivery performance.
- Engagement and response, where tracked.
- Differences between targeted audiences.
- Attendance following relevant promotions.
- Opt-outs and other negative engagement signals.
What to do with the information:
If a campaign receives a strong response, examine the audience, timing, message, and offer. Determine which elements may have contributed to the result before repeating it.
If delivery is weak, investigate contact-data quality and messaging issues.
If engagement is low, consider whether the message was relevant to the selected audience or whether the timing was appropriate.
If a campaign receives clicks but does not produce the intended attendance outcome, review the journey after the click. Was the event information clear? Was the session date suitable? Did recipients understand what action to take?
Do not rank campaigns only by open rates or clicks. The most useful campaign is the one that meets its defined objective.
5. Offer Redemptions: Are Players Using the Rewards You Promote?
A hall may invest time in creating a loyalty offer, but how can operators tell whether players are using it?
Redemption reporting helps answer that question.
It shows how many eligible offers were used during the selected period and can help operators compare participation across different promotions.
Yet redemption numbers require context.
A high redemption count does not automatically mean that the offer generated additional attendance. Some players may have redeemed a reward during a visit they would have made anyway.
What to review:
- Total redemptions during the week.
- Redemption rates for individual offers, where available.
- Which player groups used each reward.
- Offers with little or no participation.
- Attendance patterns associated with redeemed offers.
What to do with the information:
If an offer receives little participation, investigate whether players understood it, whether the conditions were clear, and whether the reward was relevant to the intended audience.
If redemption is strong, check whether the offer also supported the wider objective, such as repeat attendance or participation in a particular session.
If several offers are running simultaneously, compare them carefully rather than assuming the most popular one is automatically the most effective.
The aim is to understand which rewards deserve further testing and which need to be revised or retired.
6. List Health: Are Your Communications Reaching the Right People?
A large contact list can look impressive, but list size alone does not indicate marketing quality.
If a significant proportion of contacts are disengaged, have invalid details, or have opted out, the database may be less useful than its headline size suggests.
List health helps operators understand whether their communication audience remains accurate, engaged, and appropriate for future campaigns.
What to review:
- Current contactable audience size.
- New opt-ins and opt-outs.
- Changes in engagement.
- Invalid or outdated contact information, where identifiable.
- Frequency of communication to the same players.
What to do with the information:
If opt-outs increase, review recent campaign frequency, relevance, and audience selection.
If engagement declines, investigate whether messages are becoming repetitive or whether the same promotion is being sent too often.
If contact information is outdated, establish a process for correcting records.
Do not try to solve every list-health problem by sending more messages. A smaller, accurate, appropriately permissioned audience can be more useful than a larger list filled with contacts who do not want to receive communications.
7. Replies and Player Responses: What Are Members Trying to Tell You?
Where two-way messaging is available, replies provide another source of operational information.
Players may ask about session times, event details, rewards, registration, or other practical matters.
These responses can reveal questions that standard campaign reports do not answer.
For example, a hall may send an event promotion that receives several replies asking for clarification about the schedule. The campaign may have generated interest, but the message itself did not provide enough information.
What to review:
- Number of player replies.
- Common questions or requests.
- Response times from staff.
- Repeated confusion about events or offers.
- Messages requiring follow-up.
What to do with the information:
If players repeatedly ask the same question, improve the original campaign message or update the information available on the hall's website.
If staff struggle to respond promptly, review how incoming messages are assigned and handled.
If players ask about a particular event or session, use that feedback as an additional input when planning future communications.
Replies are not simply another engagement number. They can help operators identify where communication and customer service need improvement.
A Practical Weekly Dashboard Review: What to Do in 30 Minutes
A weekly analytics review does not need to become a lengthy management meeting.
The important thing is to follow the same sequence so that operators can compare results and make decisions consistently.
Here is a practical 30-minute routine.
Minutes 0–5: Establish the overall picture
Review new signups, visit-frequency trends, and last-visit information.
Ask whether the hall's audience and attendance patterns look broadly stable compared with the previous week.
Minutes 5–10: Investigate player activity
Look for groups whose attendance has changed.
Identify new members who may need a welcome follow-up and established players whose attendance patterns deserve review.
Minutes 10–15: Evaluate campaigns
Review delivery, engagement, responses, and attendance-related outcomes.
Identify the strongest and weakest campaigns, then consider why the results may differ.
Minutes 15–20: Check rewards and list health
Review redemptions, opt-outs, and contact engagement.
Look for offers that need adjustment and signs that communication frequency or relevance needs attention.
Minutes 20–25: Decide next week's priorities
Choose the campaigns and operational actions that address the most important findings.
Avoid trying to solve every issue at once. Select a small number of priorities that the team can realistically implement.
Minutes 25–30: Record and share the decisions
Document the key findings, assigned actions, responsible team members, and review dates.
Export a summary where available so that the team can compare performance over time.
This routine turns the dashboard into a repeatable management process rather than a report that gets opened once and forgotten.
What Should Operators Actually Do When a Metric Changes?
A dashboard can show that something has changed. It cannot always explain why.
The following examples show how to move from a metric to a sensible investigation.
| Dashboard finding | Possible explanation | Recommended action |
| New signups increase, but repeat visits remain low | New members may not be receiving effective follow-up | Review the welcome journey and second-visit rate |
| Visit frequency declines among regulars | Established attendance routines may be changing | Investigate affected sessions and player groups |
| Last-visit gaps increase | More members may be becoming inactive | Review attendance history and plan appropriate outreach |
| Campaign delivery is strong, but engagement is weak | Message relevance or timing may need improvement | Test different messages and audience groups |
| Redemptions are low | Offer conditions or reward relevance may be unclear | Review the offer and how it is communicated |
| Opt-outs increase | Players may be receiving irrelevant or excessive messages | Review campaign frequency and consent records |
| Player replies repeat the same question | Campaign information may be incomplete | Improve message clarity and staff follow-up |
These are diagnostic starting points, not automatic explanations. Operators should check the underlying records and consider external factors before changing a campaign or operating process.
The Weekly Dashboard Mistakes That Lead to Poor Decisions
Even a well-designed analytics dashboard can produce misleading conclusions if the numbers are interpreted incorrectly.
Comparing weeks without considering the calendar
A special event, holiday, seasonal change, or altered session schedule can influence attendance.
Comparing two weeks without considering these differences may lead operators to credit or blame the wrong activity.
Better approach: Compare similar periods where practical, and record unusual events that could affect the results.
Treating every increase as a success
More signups, more clicks, and more redemptions can look positive. But each measure needs to be connected to the objective behind it.
Better approach: Define the desired outcome before launching a campaign, then evaluate the relevant result.
Reacting to one week's decline
A single weak week may reflect temporary circumstances rather than a lasting problem.
Better approach: Check whether the change continues across several periods and whether it affects a particular audience or session.
Focusing on averages instead of player groups
A stable average can hide declining activity among one group and improving activity among another.
Better approach: Break down results by meaningful player segments, such as new members, regular attendees, VIPs, and lapsed members.
Recording reports without assigning actions
A weekly report has little operational value if nobody knows what should happen next.
Better approach: Give each important finding a decision, an owner, and a review date.
How to Turn Weekly Reporting Into a Better Marketing Calendar
One of the most useful outcomes of an analytics review is a clearer plan for the next week.
Instead of planning campaigns solely around what the hall wants to promote, use previous results to decide what different groups may need.
Consider this fictional example:
A hall's weekly review reveals three findings:
- New member signups are stable, but repeat visits are lower than expected.
- Regular Friday attendees remain consistent.
- A recent midweek event campaign received engagement but produced limited attendance.
The next week's plan could include:
For new members: Improve the welcome communication and provide clear information about upcoming sessions.
For Friday regulars: Maintain the existing event reminder approach rather than unnecessarily increasing message frequency.
For midweek audiences: Review the previous promotion, clarify the event information, and test a more relevant audience or message.
This is a more deliberate approach than sending one general announcement to the entire database.
The weekly dashboard should influence campaign planning, but it should not dictate every decision. Operators still need to consider the hall's event calendar, available resources, player preferences, and operational priorities.
Keeping Weekly Reports Useful Across Multiple Locations
For operators managing more than one hall, reporting consistency becomes especially important.
Each location may have different attendance patterns, session schedules, player demographics, and campaign needs. A combined report can help management understand the overall position, but it should not hide differences between venues.
A useful multi-location review should separate two questions:
What is happening across the organisation?
This includes overall signup trends, campaign activity, attendance patterns, and loyalty participation.
What is happening at each individual location?
This helps identify whether a particular hall needs attention, whether a successful campaign can be adapted elsewhere, or whether local circumstances explain different results.
For example, a campaign may perform well at one venue because its audience prefers weekend sessions. The same message may be less relevant at a location whose attendance is concentrated on weekdays.
Standardise the metrics and reporting periods, but allow local campaign decisions to reflect each hall's circumstances.
How JustKonnect Helps Bingo Operators Review Performance
JustKonnect's Analytics feature is designed around the weekly reporting needs of bingo operators. Its stated reporting areas include new signups, visit-frequency trends, last-visit trends, campaign performance, offer redemptions, and contact-list engagement.
The platform's approach connects these measures to practical operator decisions: reviewing audience growth, identifying players who may need re-engagement, evaluating campaign performance, and deciding which promotions should be repeated or revised.
Its reporting workflow is intended to support a consistent routine:
- Run campaigns and promotions.
- Track available engagement and outcome information.
- Review weekly KPIs.
- Export summaries for internal use.
- Use the findings to refine future campaigns.
JustKonnect also provides Player Profiles & CRM, which brings together player information such as visit history, contact details, and loyalty status. This can provide additional context when operators investigate changes in attendance.
For halls that want to review campaign activity and reward performance together, the platform's Customer Segmentation and Loyalty Points & Rewards capabilities support more focused audience and programme management.
The Exportable Reports feature is also relevant for operators who need to share performance summaries with managers or other stakeholders.
The practical benefit is not simply having more numbers on a screen. It is making the information easier to review, discuss, and turn into consistent operating decisions.
Feature availability and reporting depth should be confirmed with JustKonnect when evaluating the platform for a particular hall or multi-location operation.
Frequently Asked Questions
What should a bingo hall analytics dashboard show?
A useful dashboard should provide visibility into new signups, visit-frequency trends, last-visit dates, campaign performance, offer redemptions, and contact-list engagement. Additional reporting may include replies, loyalty activity, and exportable summaries, depending on the platform and configuration.
How often should bingo hall operators review analytics?
A weekly review is a practical starting point because bingo halls typically operate around recurring sessions and promotional calendars. Operators can also check specific campaign results after a promotion and review longer-term trends monthly or quarterly.
Which KPI is most important for a bingo hall?
There is no single KPI that explains the health of a hall. Visit frequency, repeat attendance, new signups, campaign outcomes, and offer redemptions each answer different questions. Operators should prioritise the metrics that align with their current objectives.
How can a bingo hall measure whether an SMS campaign worked?
Review delivery and engagement metrics, then compare relevant attendance outcomes during the campaign period. If possible, use a suitable comparison group to assess whether the campaign contributed to additional visits. A delivered message or click does not automatically mean the campaign generated attendance.
What should operators do when attendance declines?
First identify whether the decline is concentrated in a particular session or player group. Review visit-frequency and last-visit trends, check for schedule or seasonal changes, and investigate possible causes before deciding whether to adjust the event calendar, campaign targeting, or retention approach.
Why are exportable reports useful for bingo halls?
Exportable reports make it easier to share consistent performance summaries with managers, teams, and relevant stakeholders. They can also reduce the need to manually combine information from separate spreadsheets, provided the exported data is accurate and appropriate for the intended review.
Can analytics help a bingo hall improve player retention?
Analytics can help operators identify changes in visit frequency, last-visit patterns, and campaign engagement that may warrant attention. The information can support more focused retention activity, although improved retention depends on the quality of the data, the relevance of the response, and other factors affecting player attendance.
Make Monday's Review Useful for the Rest of the Week
A bingo hall does not need a complicated reporting process to make better decisions. It needs a consistent one.
Review new signups to understand audience growth. Examine visit frequency and last-visit trends to understand player activity. Evaluate campaigns according to their intended outcomes. Check redemptions and list health before deciding what to promote next.
Most importantly, turn each meaningful finding into a clear action.
A dashboard that only reports last week's numbers is a record of what happened. A dashboard that helps operators decide what to investigate, improve, and repeat becomes part of how the hall is managed.
Explore JustKonnect Analytics to see how weekly KPIs, campaign reporting, and exportable summaries can support a more consistent approach to bingo hall performance management.