The reverse raffle is over.
The winner has been announced. Prizes have been distributed. The last guests have gone home.
For the event team, it can be tempting to move straight on to the next fundraiser.
But another important stage happens after the draw: figuring out what the event actually achieved.
How many tickets were sold?
How much money did the event generate?
Which marketing channels brought in participants?
How many ticket holders actually attended?
How much did the prizes and event cost?
Did previous participants come back?
And what should change before the next reverse raffle?
These questions are more useful than simply asking whether the event “went well.”
A reverse raffle produces several different types of data. Looking at them together can show where the event generated results, where the process created friction, and which parts of the next fundraiser deserve more attention.
Start With the Numbers That Describe the Event
Before looking at marketing performance or attendee behavior, establish the basic facts.
Create a simple post-event record containing:
- Total ticket capacity
- Tickets sold
- Tickets remaining
- Ticket price
- Gross ticket revenue
- Prize costs
- Event costs
- Marketing costs
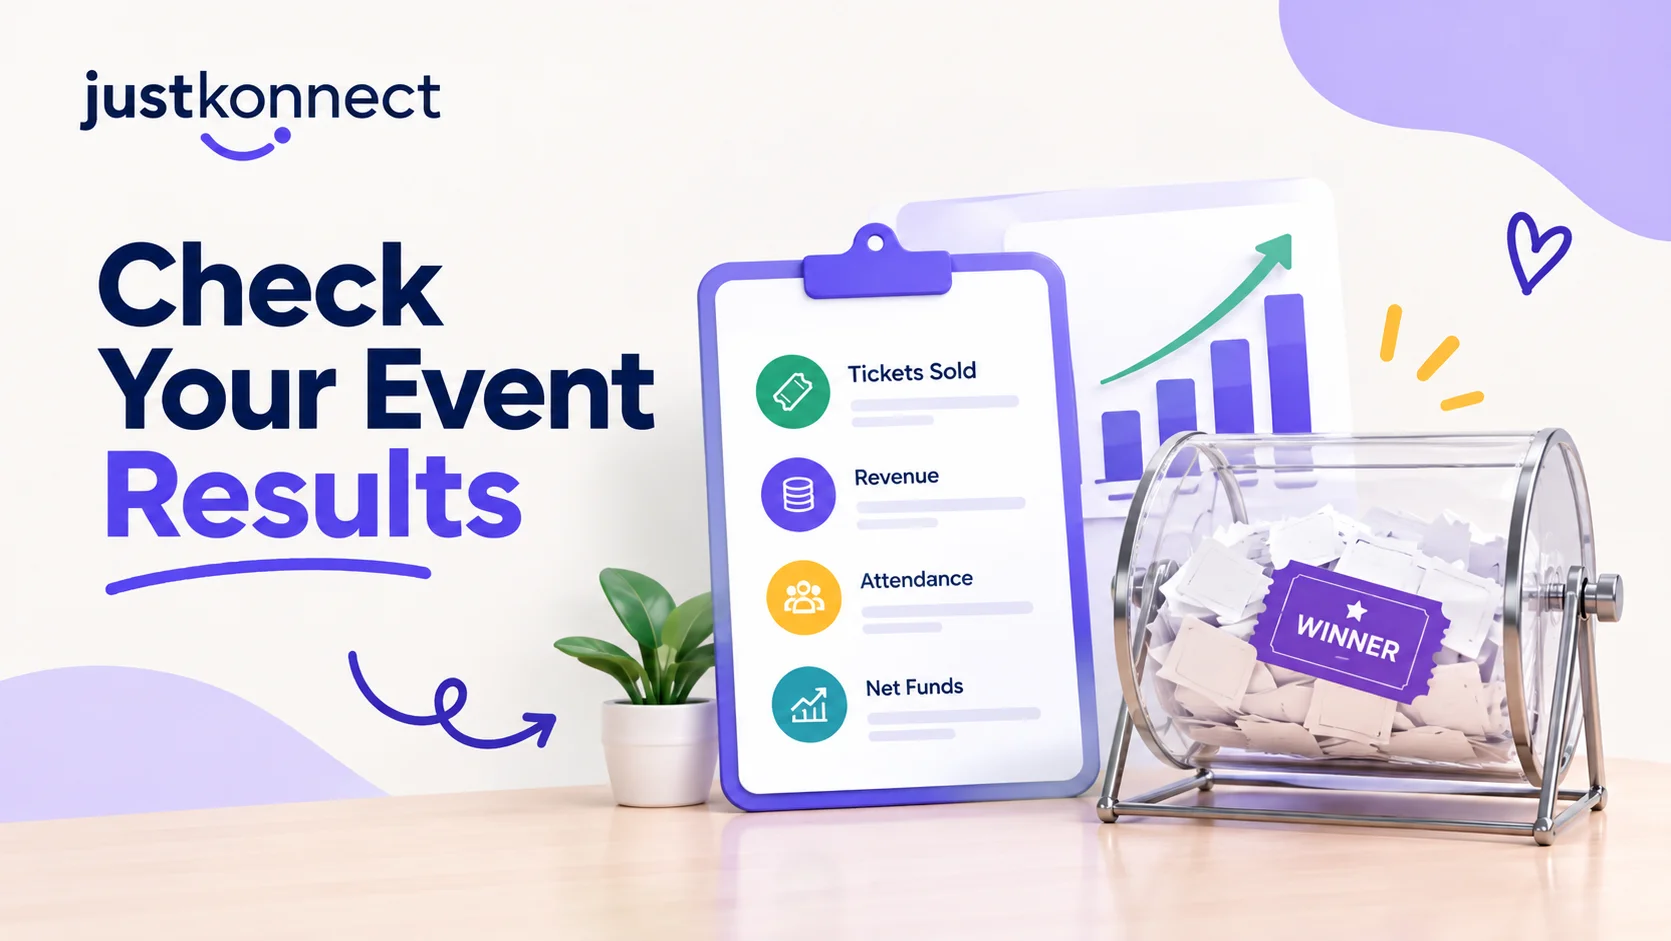
- Net funds raised
- Number of attendees
- Number of winners or prize recipients
- Number of sponsors, where applicable
These numbers give you the basic financial and operational picture.
For example, imagine a charity runs a 300-ticket raffle at $25 per ticket.
If 280 tickets are sold, the potential ticket revenue is:
280 × $25 = $7,000
But $7,000 in ticket sales does not automatically mean the organization raised $7,000.
Prize costs, venue expenses, marketing, staffing, payment processing, and other event costs may reduce the amount ultimately available to the organization.
That distinction should be clear in your post-event reporting.
Measure Gross Revenue and Net Funds Separately
One of the easiest mistakes is reporting only gross ticket revenue.
Gross revenue tells you how much money came in.
Net funds raised tells you what remained after relevant costs.
A simple calculation is:
Net Funds Raised = Gross Revenue − Event Costs
Depending on the organization's accounting approach, those costs might include:
- Prize expenses
- Venue costs
- Catering
- Entertainment
- Marketing
- Printing
- Payment processing
- Staffing
- Software
- Other event expenses
Keeping these figures separate makes future planning much easier.
If the next event has a similar ticket price but substantially higher costs, the team can see where the difference comes from.
Look at Ticket Sales as a Timeline
Total tickets sold is useful.
But when those tickets were sold can tell you much more.
Imagine a 300-ticket reverse raffle with these sales figures:
| Time Before Event | Tickets Sold |
| 6 weeks | 45 |
| 4 weeks | 90 |
| 2 weeks | 155 |
| 1 week | 220 |
| 3 days | 265 |
| Event day | 280 |
The event ultimately sold 280 tickets.
But the sales pattern shows something else: a large portion of purchases happened during the final two weeks.
That information could influence the next campaign.
Perhaps early promotion needs improvement.
Perhaps supporters naturally wait until closer to the event.
Perhaps the final countdown campaign generated additional demand.
The timeline gives you something that the final ticket total cannot.
Calculate the Ticket Sell-Through Rate
If your raffle has a fixed number of tickets, calculate how much of the available inventory was sold.
The formula is:
Sell-Through Rate = Tickets Sold ÷ Total Tickets Available × 100
For example:
280 ÷ 300 × 100 = 93.3%
That gives the organization a simple way to compare different events.
A 300-ticket raffle selling 280 entries and a 500-ticket raffle selling 420 entries have different sales volumes, but their sell-through rates provide additional context.
This metric can also help when deciding whether future events should have more or fewer available entries.
Measure Average Revenue Per Participant
Another useful metric is the average revenue generated per attendee or participant.
For example:
Gross Ticket Revenue ÷ Ticket Purchasers
If 280 tickets generate $7,000 from 210 purchasers:
$7,000 ÷ 210 = $33.33
This can help reveal purchasing behavior.
If participants commonly buy multiple entries, the organization may want to understand what proportion of purchasers bought one ticket versus several.
That can be more informative than simply looking at the total number of tickets sold.
Look at Single-Ticket vs. Multiple-Ticket Purchases
Not every participant contributes in the same way.
Suppose your event had:
- 120 people buying one ticket
- 50 people buying two tickets
- 20 people buying five tickets
The total number of participants and total number of tickets are telling you different things.
Tracking both can help answer:
Are we reaching many individual supporters, or are a smaller number of supporters buying multiple entries?
Neither figure needs to be interpreted in isolation.
The answer may influence future ticket bundles, promotions, supporter outreach, or event capacity.
Measure Attendance Separately From Ticket Sales
A sold ticket doesn't necessarily mean someone attended.
That makes attendance an important post-event metric.
For example:
Tickets sold: 280
Ticket holders attending: 245
Attendance rate: 87.5%
The calculation is:
Attendance Rate = Attendees ÷ Ticket Holders × 100
Why does this matter?
Because a strong ticket-sales result can hide an attendance problem.
If many ticket holders don't attend, the organization may need to examine:
- Event reminders
- Start times
- Venue accessibility
- Communication
- Ticket transfer procedures
- Event-day instructions
- Scheduling conflicts
- Whether remote participation was available
This is where post-event analysis becomes more useful than a simple revenue report.
Find Out Where Your Participants Came From
If the reverse raffle was promoted through several channels, try to identify which ones generated ticket sales.
For example:
| Channel | Tickets Attributed |
| SMS | 85 |
| 60 | |
| Social Media | 45 |
| Website | 35 |
| Previous Event | 30 |
| Partner/Sponsor | 25 |
The exact numbers will vary, and attribution may not always be perfect.
But even imperfect tracking can help identify patterns.
If one channel consistently produces participants while another generates awareness but few ticket purchases, the organization can investigate the difference before the next event.
Don't Confuse Reach With Ticket Sales
A marketing campaign can generate thousands of impressions without selling many tickets.
That isn't necessarily a failure.
Awareness and conversion are different stages.
For a reverse raffle, the post-event report should ideally distinguish between:
Reach: How many people were exposed to the promotion?
Engagement: How many interacted with the campaign?
Interest: How many visited the ticket page or asked about the event?
Conversion: How many purchased?
Attendance: How many actually attended?
This creates a clearer picture of the participant journey.
JustKonnect's analytics tools are designed to track campaign delivery, response, outcomes, engagement, and related performance metrics through a centralized dashboard.
Review SMS Performance Separately
If SMS was part of the reverse raffle promotion, don't stop at counting how many messages were sent.
Look at:
- Number of recipients
- Delivery rate
- Responses
- Link activity, where tracked
- Ticket purchases associated with the campaign
- Attendance among SMS recipients
- Opt-outs
- Performance of different messages
For example, suppose you sent three promotional SMS campaigns.
Campaign A: Event announcement
Campaign B: Two-week reminder
Campaign C: Final ticket countdown
If Campaign C generated substantially more ticket activity than Campaign A, that doesn't automatically mean the final message was “better.”
People may have already become aware of the event from Campaign A and simply needed the later reminder to act.
The important insight is understanding how the messages worked together.
Review the Ticket-Sales Funnel
A useful post-event exercise is to map the path from promotion to attendance.
Think about the funnel as:
Audience → Event Interest → Ticket Purchase → Attendance → Future Engagement
At each stage, ask what happened.
Stage 1: Audience
How many people could potentially receive the promotion?
Stage 2: Interest
How many showed some indication of interest?
Stage 3: Purchase
How many bought tickets?
Stage 4: Attendance
How many ticket holders attended?
Stage 5: Future Engagement
How many remained connected with the organization?
This framework prevents the post-event review from becoming just a revenue spreadsheet.
Measure New vs. Returning Participants
A reverse raffle can attract people who have never participated in one of your events.
It can also bring back previous supporters.
Track the difference.
For example:
New participants: 80
Returning participants: 130
This helps answer a useful question:
Was the event primarily reaching a new audience, re-engaging existing supporters, or doing both?
You can then compare the results with previous events.
If returning participation is declining, the organization may want to examine its follow-up and retention efforts.
If new participation is increasing, it may be useful to understand which promotional channels introduced those supporters to the event.
Look Beyond the Event Night
The reverse raffle may be over, but participant engagement doesn't necessarily end there.
Measure what happens after the event.
For example:
- How many participants opened post-event communications?
- How many responded?
- How many joined another event?
- How many made another donation?
- How many volunteered?
- How many remained subscribed to communications?
- How many returned for the next fundraiser?
These metrics can help organizations understand whether the event created one-time participation or longer-term supporter relationships.
JustKonnect's broader platform includes player profiles, customer segmentation, visit frequency tracking, last-visit tracking, and customer behavior analytics.
Review the Cost of Acquiring Participants
If you spent money promoting the reverse raffle, calculate the cost associated with acquiring participants.
A simple version is:
Customer Acquisition Cost = Marketing Spend ÷ New Participants
For example:
If $500 was spent on promotion and 50 new participants attended:
$500 ÷ 50 = $10 per new participant
This doesn't tell you everything about the value of those participants.
But it gives you a starting point for comparing campaigns.
If one promotion costs $10 per new participant and another costs $25, the organization can investigate why.
Measure the Cost of the Event Itself
Revenue should always be considered alongside expenses.
A simple event cost report might look like:
| Expense | Amount |
| Prizes | $2,500 |
| Venue | $600 |
| Marketing | $400 |
| Catering | $350 |
| Software | $150 |
| Other | $200 |
| Total | $4,200 |
If gross ticket revenue was $7,000:
$7,000 − $4,200 = $2,800
That gives you a clearer picture of the amount generated after those recorded costs.
For recurring events, maintaining this information consistently makes year-over-year comparisons much easier.
Review Prize Costs Against Participation
Prize structure can affect both event economics and participant interest.
After the event, record:
- Grand prize cost
- Runner-up prizes
- Consolation prizes
- Sponsor-provided prizes
- Other promotional costs
- Total prize expense
Then compare those costs with ticket sales and participation.
The objective isn't simply to reduce prize spending.
Instead, understand how the prize structure fits into the overall economics of the event.
A sponsor-funded prize, for example, may have a different financial impact from a prize purchased entirely by the organization.
Measure the Operational Side Too
Not every useful metric is financial.
Your team should also review how difficult the event was to operate.
Ask:
- How long did ticket sales take to process?
- How much staff time was spent preparing entries?
- Were there duplicate or incorrect records?
- How many participant questions required manual investigation?
- Did the draw experience delays?
- How quickly were winners identified?
- How long did post-event reconciliation take?
- Were reports easy to produce?
These questions matter because an event can produce strong revenue while still creating excessive administrative work.
The operational review helps identify where automation could reduce future workload.
Compare Manual Work With Event Results
Suppose two reverse raffles generate similar revenue.
Event A requires:
- Four staff members
- Several spreadsheets
- Manual ticket reconciliation
- Manual winner records
- Several hours of post-event reporting
Event B requires:
- Two staff members
- Centralized ticket records
- Automated draw management
- Digital winner records
- Exportable reports
The revenue figures alone wouldn't show this difference.
Operational effort should be part of the post-event review.
JustKonnect's Reverse Raffle Software combines ticket sales, real-time entry tracking, automated drawing, winner management, notifications, and reporting within the reverse raffle workflow.
Review What Happened During the Draw
The draw itself can produce useful operational information.
Record things such as:
- Number of entries at the start
- Number of eliminations
- Length of the draw
- Any interruptions
- Participant questions
- Winner notification process
- Prize distribution process
- Technical issues
- Staff interventions
If the event took longer than expected, ask why.
Was the draw format too long?
Were announcements causing delays?
Did staff need to manually verify numbers?
Were participants unclear about the rules?
These observations can help improve the next event without relying entirely on financial metrics.
Use a Simple Event Scorecard
Instead of creating a massive report that nobody reads, create a concise post-event scorecard.
For example:
| Metric | Result |
| Tickets available | 300 |
| Tickets sold | 280 |
| Sell-through rate | 93.3% |
| Gross ticket revenue | $7,000 |
| Total event costs | $4,200 |
| Net funds raised | $2,800 |
| Ticket holders attending | 245 |
| Attendance rate | 87.5% |
| New participants | 80 |
| Returning participants | 130 |
| Marketing spend | $400 |
| New participants from marketing | 40 |
Then add a second section for observations.
What worked
- Strong final-week ticket sales
- High attendance
- Good response from previous participants
What needs attention
- Early ticket sales were slow
- Several manual ticket corrections were required
- Some attendees missed event-time information
This makes the report useful for planning rather than simply documenting what happened.
Compare Events Using the Same Metrics
One event's numbers don't tell you much by themselves.
The real value comes from comparison.
Use the same core metrics for every reverse raffle:
- Tickets available
- Tickets sold
- Sell-through rate
- Gross revenue
- Total costs
- Net funds raised
- Attendance
- New participants
- Returning participants
- Marketing spend
- Cost per new participant
- Post-event engagement
- Staff time
Over time, you can see whether the event format, promotion, attendance, and operational process are changing.
JustKonnect's analytics and exportable reporting tools are designed around recurring performance review, with campaign outcomes, attendance patterns, engagement, and other metrics available for reporting.
Turn the Report Into Next Year's Plan
The purpose of measuring performance isn't to create a report and file it away.
Use the findings to make specific changes.
For example:
Finding: Most tickets were sold during the final seven days.
Possible action: Test an earlier awareness campaign and monitor whether sales move forward.
Finding: Attendance was significantly lower than ticket sales.
Possible action: Review reminder timing and event-day communication.
Finding: A large amount of staff time went into manual ticket reconciliation.
Possible action: Evaluate centralized ticket tracking.
Finding: Returning participants represented a large portion of sales.
Possible action: Plan a dedicated early announcement for previous participants.
Finding: One marketing channel produced more new participants than others.
Possible action: Examine that channel's campaign structure and consider testing it again.
This turns measurement into an operational feedback loop.
What Should You Track in JustKonnect?
A reverse raffle produces information that can sit alongside the wider data already collected by a bingo or charity gaming operation.
JustKonnect's platform includes campaign performance, revenue and ROI tracking, visit frequency, last-visit tracking, spend history, churn alerts, customer behavior analytics, and exportable reports.
That broader view can help operators connect an event with the participant activity around it.
For example, the team can look beyond:
“How many tickets did we sell?”
and start asking:
“Who participated?”
“How did they hear about the event?”
“Did they attend?”
“Did they participate again?”
“Which campaigns generated the strongest response?”
Those questions make the post-event review much more useful.
Create a 10-Minute Post-Event Review
You don't need a 50-page report every time.
A short review can cover the essential information.
Financial
- Gross revenue
- Event costs
- Net funds raised
Ticket Sales
- Tickets available
- Tickets sold
- Sell-through rate
- Average tickets per purchaser
Attendance
- Ticket holders
- Actual attendees
- Attendance rate
Marketing
- Best-performing channel
- Campaign response
- New participants
- Marketing cost
Operations
- Staff workload
- Ticket issues
- Draw issues
- Winner management
- Reporting time
Follow-Up
- Thank-you communication
- New supporter engagement
- Repeat participation
- Future event opportunities
Finish with three questions:
What should we repeat?
What should we change?
What should we test next time?
That is enough to turn the event data into a practical planning document.
Frequently Asked Questions
What should I measure after a reverse raffle?
Start with tickets sold, sell-through rate, gross revenue, event costs, net funds raised, attendance, marketing performance, and participant activity. Operational metrics such as staff time and ticket-management issues can also be useful.
How do I calculate reverse raffle ROI?
A simple calculation is to compare the financial return generated by the event with the costs associated with running and promoting it. The exact formula should match the organization's accounting method and what it considers part of the event investment.
Should I track attendance separately from ticket sales?
Yes. Ticket sales and attendance measure different things. Tracking both can show whether ticket holders actually attended and whether additional reminders or event communication may be needed.
How can I measure which marketing channel worked best?
Track ticket purchases or registrations back to the relevant campaign or channel where possible. Compare channels using consistent measurements such as purchases, new participants, cost per participant, and revenue generated.
What should I do with the data after the event?
Use it to document the event, compare results with previous fundraisers, identify operational issues, and make specific changes to the next campaign. A consistent reporting format makes year-to-year comparisons easier.
Can reverse raffle software help with post-event reporting?
Yes. JustKonnect's Reverse Raffle Software includes reporting for sales, winners, and financial information, while its broader analytics platform provides campaign, engagement, attendance, and revenue-related reporting capabilities.
The Most Useful Report Is the One You Actually Use
Measuring a reverse raffle shouldn't become another administrative exercise that ends up in a folder nobody opens again.
The useful report is the one that explains what happened clearly enough to influence the next event.
Start with the money.
Then look at ticket sales.
Check attendance.
Review marketing.
Examine participant behavior.
Measure the operational workload.
Finally, compare those results with previous events.
The goal is not to reduce the entire fundraiser to a single number.
It is to understand the different parts of the event well enough to make the next one more informed, easier to manage, and easier to evaluate.
JustKonnect's Reverse Raffle Software brings ticket sales, entry tracking, automated drawing, winner management, notifications, and reporting into one workflow, while its wider analytics tools provide campaign and performance reporting for broader bingo operations.
If you're looking to move from manually assembling post-event numbers to a more connected reverse raffle workflow, explore JustKonnect's Reverse Raffle Software and see how event data can be captured throughout the process rather than reconstructed after the draw.