A bingo hall sends 2,000 promotional messages about an upcoming Saturday event. Most are delivered, several players respond, and a number of offers are redeemed.
The campaign report looks encouraging.
But did the messages actually bring more people into the hall? Did they reach players who would not normally attend? Were the rewards responsible for additional visits, or did regular attendees simply use an offer they would have redeemed anyway?
These are the questions that separate campaign reporting from campaign evaluation.
A delivery report can show that a message reached a phone. An engagement report can show that someone interacted with it. Neither automatically proves that the campaign achieved its business objective.
For bingo hall operators, the most useful campaign metrics connect communication activity with player behavior and attendance outcomes.
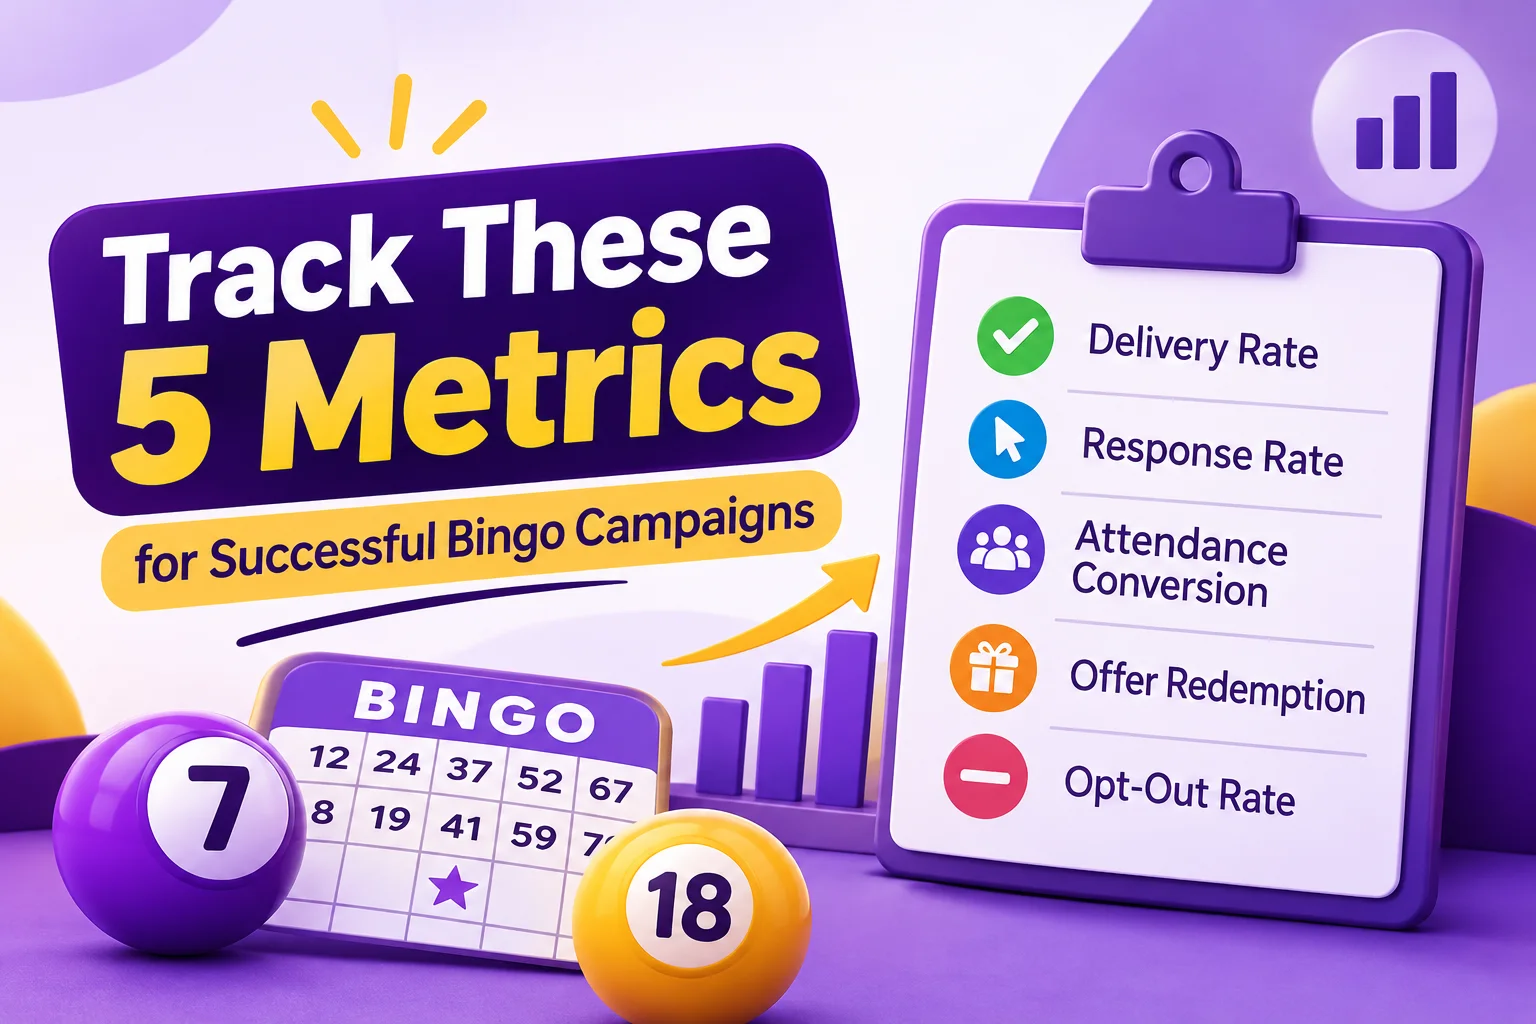
Rather than trying to monitor every available number, start with five measures: delivery rate, response rate, attendance conversion, offer redemption, and opt-out rate.
Each tells you something different. Together, they provide a more useful way to evaluate weekly promotions and decide what deserves to be repeated, changed, or stopped.
1. Delivery Rate: Did Your Campaign Reach the Intended Audience?
Before evaluating whether a campaign persuaded anyone to attend, establish whether the message reached its intended audience.
Delivery rate measures the proportion of submitted messages that were successfully delivered, according to the reporting definition used by the messaging provider.
For an SMS campaign, a message marked as delivered has reached the recipient's device or network delivery endpoint as reported by the provider. It does not mean the person read it, understood it, or intends to visit.
How to calculate delivery rate
[
\text{Delivery Rate} =
\frac{\text{Successfully Delivered Messages}}{\text{Messages Sent}}
\times 100
]
For example, imagine a bingo hall sends 1,000 SMS messages for a special Friday session.
- Messages sent: 1,000
- Successfully delivered: 950
- Delivery rate: 95%
This means 95% of submitted messages were reported as successfully delivered.
<text color="secondary" size="xs">Illustrative example, not a JustKonnect customer result or industry benchmark.</text>
What a low delivery rate might mean
If delivery falls compared with previous campaigns, investigate the underlying records rather than immediately rewriting the promotional message.
Possible causes include:
- Incorrect or outdated phone numbers.
- Invalid contact records.
- Network or provider delivery issues.
- Messaging restrictions or filtering.
- Problems with the campaign's contact list.
A delivery problem is different from an engagement problem. Changing the message wording will not fix an invalid phone number.
What should operators do with this metric?
Review delivery rates across campaigns and look for unusual changes.
If a particular audience has consistently weaker delivery, check the quality of its contact records. If delivery falls across several campaigns at once, investigate whether a wider technical or provider issue is affecting messaging.
Also distinguish between submitted, accepted, delivered, and failed messages where the reporting system provides those statuses. Different platforms may define these stages differently.
Operator's decision: Is the campaign reaching the people it was supposed to reach, or does the contact data need attention?
2. Response Rate: Did Players Show Any Interest?
A delivered message is only the beginning of the communication process.
The next question is whether players interacted with it.
Response rate measures how many recipients took a defined action after receiving a campaign. Depending on the channel and available tracking, that action might be clicking a link, replying to an SMS, or engaging with a message through another measurable interaction.
The important point is to define what counts as a response before comparing campaigns.
An SMS reply and an email click are not identical actions. They indicate different types of engagement and should not automatically be treated as interchangeable.
How to calculate response rate
For a campaign where responses are measured against delivered messages:
[
\text{Response Rate} =
\frac{\text{Unique Responders}}{\text{Successfully Delivered Messages}}
\times 100
]
Suppose the hall's Friday campaign reaches 950 players, and 114 unique recipients reply or complete the tracked action.
The response rate is:
[
\frac{114}{950}\times100 = 12%
]
This indicates that 12% of delivered recipients completed the defined response action.
<text color="secondary" size="xs">Illustrative calculation. The response definition must remain consistent between campaigns.</text>
What does response rate actually tell you?
It can help operators understand whether the audience found the message relevant enough to interact with.
A campaign promoting a special event may generate more responses than a routine session reminder. A message sent to players who regularly attend the promoted session may also behave differently from one sent to a broader audience.
But a higher response rate does not automatically mean a better campaign.
For example, a message might generate many replies asking for clarification because the original offer was confusing. The interaction count looks positive, but the campaign has created additional work for staff.
Similarly, a player might click an event link without attending.
What should operators do with this metric?
Compare response rates across campaigns with similar objectives and channels.
If responses are weak, investigate:
- Whether the message explains the offer clearly.
- Whether the event is relevant to the selected audience.
- Whether the communication arrived at an appropriate time.
- Whether the call to action is easy to understand.
- Whether players have a reason to respond.
If replies reveal repeated questions, improve the campaign copy. If a particular audience consistently responds well to relevant event updates, consider using that insight when planning future communications.
Avoid increasing message frequency simply because one campaign receives few responses. More messages do not necessarily create more interest.
Operator's decision: Are players interacting with the campaign, and does that interaction indicate genuine interest or a problem that needs fixing?
3. Attendance Conversion: Did the Campaign Bring Players Into the Hall?
This is where campaign measurement becomes more closely connected to the outcome that matters to a bingo operator.
A campaign can achieve excellent delivery and response rates while producing little change in attendance.
For example, players may click an event link because they are curious, but never visit. Others may attend without clicking anything because they already know the session schedule.
Attendance conversion examines whether campaign recipients subsequently attend the promoted session or visit the hall during a defined measurement period.
How to calculate attendance conversion
One practical approach is to calculate the proportion of campaign recipients who attended during the selected period.
[
\text{Attendance Conversion Rate} =
\frac{\text{Campaign Recipients Who Attended}}{\text{Eligible Campaign Recipients}}
\times100
]
Imagine that a hall sends a campaign to 800 eligible players promoting a special Wednesday session.
During the measurement window, 96 recipients attend.
[
\frac{96}{800}\times100 = 12%
]
The campaign recipient attendance rate is 12%.
<text color="secondary" size="xs">Illustrative example. This figure does not prove that the campaign caused all 96 visits.</text>
Why attendance conversion needs careful interpretation
Some recipients may have attended regardless of the campaign.
A regular Wednesday player, for example, might already have planned to visit. Counting that person as a campaign conversion does not establish that the message generated an additional visit.
This is the difference between measuring attendance among recipients and measuring incremental attendance caused by a campaign.
To understand campaign impact more reliably, operators can compare results with a suitable group of similar players who did not receive the promotion, where practical.
For example:
- Campaign group: Players who received the event message.
- Comparison group: Similar eligible players who did not receive it.
- Measurement: Attendance during the same defined period.
If attendance is higher among the campaign group, that may suggest the campaign contributed to the difference. The comparison still needs to account for differences between the groups and other influences.
What should operators do with this metric?
Review attendance outcomes alongside the campaign's original objective.
If the goal was to fill a quieter Wednesday session, examine attendance among the intended audience rather than relying only on total weekly visits.
If the goal was to encourage new players to return, measure repeat attendance among those new members.
If the goal was to reactivate inactive players, review how many recipients returned and whether they continued attending afterward.
Operator's decision: Did the campaign support the attendance objective, and is there evidence that it contributed to additional visits?
4. Offer Redemption Rate: Are Players Using the Promotion?
A promotional campaign may include a loyalty reward, voucher, eligible discount, complimentary item, or another benefit.
Redemption rate helps operators understand how frequently recipients use the offer.
It is particularly useful when a campaign has a clearly defined reward and the hall can track its use.
However, operators should distinguish between the number of redemptions and the percentage of eligible recipients who redeem.
How to calculate redemption rate
A useful recipient-based formula is:
[
\text{Redemption Rate} =
\frac{\text{Unique Recipients Who Redeemed}}{\text{Eligible Recipients}}
\times100
]
For example, a hall sends an offer to 500 eligible players. During the offer period, 75 unique recipients redeem it.
[
\frac{75}{500}\times100 = 15%
]
The recipient-based redemption rate is 15%.
Some reporting systems calculate redemption against issued or claimed offers instead. These figures answer different questions, so operators should always check the denominator before comparing results.
What a high redemption rate can tell you
Strong redemption may indicate that the reward was relevant, the conditions were understandable, and the offer reached an audience interested in using it.
But redemption alone does not establish profitability or additional attendance.
Consider two campaigns:
- Campaign A produces 100 redemptions among players who were already regular attendees.
- Campaign B produces 45 redemptions among previously inactive players who subsequently return.
Campaign A has more redemptions, but Campaign B may have contributed more directly to the hall's re-engagement objective.
The better result depends on what the hall intended to achieve.
What should operators do with this metric?
Compare redemption performance with the offer's purpose, audience, and cost.
If redemption is low, investigate whether the reward was attractive, whether eligibility conditions were clear, and whether players understood how to use it.
If redemption is high, examine whether it is also associated with the desired outcome, such as attendance at a particular session or repeat visits.
Avoid assuming that the most frequently redeemed offer should automatically become a permanent promotion.
Operator's decision: Are players using the offer, and is that activity supporting the business objective behind it?
5. Opt-Out Rate: Is Your Marketing Becoming Less Relevant?
Campaign performance is not only about positive interactions.
A player choosing to unsubscribe or opt out is also a meaningful signal.
Opt-out rate measures the proportion of eligible recipients who withdraw from a particular communication channel or marketing list during a defined period.
For SMS, it may reflect recipients who use the relevant unsubscribe mechanism. For email, it may represent completed unsubscribe actions.
How to calculate opt-out rate
A practical campaign-level calculation is:
[
\text{Opt-Out Rate} =
\frac{\text{Unique Opt-Outs}}{\text{Successfully Delivered Messages}}
\times100
]
Suppose a hall delivers 950 messages and receives 19 opt-outs during the campaign period.
[
\frac{19}{950}\times100 = 2%
]
The campaign's opt-out rate is 2%.
<text color="secondary" size="xs">Illustrative calculation. Reporting systems may use different denominators or attribution windows.</text>
What an increase in opt-outs might indicate
A rise in opt-outs deserves investigation, particularly if it appears after a change in campaign frequency, targeting, or promotional content.
Possible explanations include:
- Messages are being sent too frequently.
- The promotion is not relevant to the recipient.
- The player did not expect to receive marketing communications.
- The campaign does not clearly explain its purpose.
- The audience includes contacts who no longer want messages.
An opt-out does not necessarily mean the player has stopped attending the hall. They may simply prefer not to receive promotional messages through that channel.
That distinction matters. Operators should not interpret a marketing unsubscribe as proof of lost player engagement.
What should operators do with this metric?
Review opt-outs alongside delivery, response, and attendance results.
If a particular campaign generates more opt-outs than usual, investigate its audience, frequency, message content, and consent records.
Check whether multiple campaigns are reaching the same people within a short period. Consider whether the communication provides enough value to justify another message.
Most importantly, process opt-outs promptly and respect the player's communication preferences. Do not add opted-out contacts to another campaign list to compensate for declining engagement.
Operator's decision: Are players still comfortable receiving your communications, or does the campaign approach need to change?
Five Metrics, Five Different Questions
The value of tracking these metrics becomes clearer when operators understand the question each one answers.
| Metric | What it measures | The question it answers |
| Delivery rate | Successful message delivery | Did the campaign reach its intended audience? |
| Response rate | Measurable recipient interaction | Did players engage with the message? |
| Attendance conversion | Attendance among campaign recipients | Did recipients visit during the measurement period? |
| Offer redemption rate | Use of eligible promotional offers | Did players use the reward? |
| Opt-out rate | Withdrawal from marketing communications | Are recipients choosing to stop receiving messages? |
These measures should not be treated as interchangeable.
A campaign may have high delivery and low response. Another may generate strong responses but limited attendance. A third may have modest redemption but a useful effect on repeat visits.
The job of the operator is to understand the complete pattern rather than selecting whichever number looks most impressive.
How to Read the Five Metrics Together: A Campaign Example
Imagine a bingo hall runs a promotional campaign for a special Saturday event.
The operator reviews the results after the campaign closes.
| Campaign measure | Illustrative result |
| Messages sent | 1,000 |
| Successfully delivered | 950 |
| Unique responses | 114 |
| Recipients who attended | 96 |
| Unique offer redeemers | 75 |
| Opt-outs | 19 |
From these figures, the operator can calculate:
- Delivery rate: 95%.
- Response rate: 12% of delivered messages.
- Attendance conversion: 9.6% of the original 1,000 recipients, or approximately 10.1% of the 950 delivered recipients.
- Redemption rate: 7.5% of the original 1,000 recipients, assuming all were eligible, or approximately 7.9% of delivered recipients.
- Opt-out rate: 2% of delivered messages.
The difference between denominators is important. A report should clearly state whether a rate is based on messages sent, messages delivered, or eligible recipients.
Now consider what the operator should investigate.
Delivery looks strong. The campaign appears to have reached most of its intended audience. There may be little reason to change the contact list based on this result alone.
Responses provide a useful engagement signal. The operator should examine what recipients interacted with and whether replies raised any common questions.
Attendance needs further evaluation. The 96 attendees were campaign recipients, but that does not establish that all 96 visits were caused by the promotion. A comparison group could help estimate incremental impact.
Redemptions show offer usage. The hall should review whether the reward contributed to the event objective and whether its cost was justified.
Opt-outs deserve attention. The operator should check whether the rate differs from previous campaigns and whether the message frequency or audience selection needs adjustment.
This is how a collection of campaign numbers becomes a practical evaluation.
The figures are illustrative and do not represent actual JustKonnect campaign results.
How to Build a Weekly Campaign Review Without Drowning in Data
Operators do not need to spend hours reviewing every available report. A consistent routine built around these five measures is often more useful than a large spreadsheet that nobody regularly examines.
Before the campaign: Define the objective
Decide what the campaign is intended to achieve.
Is the purpose to increase attendance at a particular session, encourage new members to return, promote a reward, or reactivate an inactive audience?
Choose the relevant primary metric before sending the message.
After the campaign: Check delivery and response
Start with the technical and engagement stages.
Confirm that messages reached the intended audience and review the interactions they generated.
If delivery is weak, investigate contact records and provider issues. If response is weak, review the audience, message, timing, and call to action.
Review attendance and redemption outcomes
Once the measurement period has passed, examine whether recipients attended and whether eligible offers were used.
Keep the measurement window consistent where possible. A campaign promoting a Saturday event should not be evaluated using an unrelated attendance period.
Check opt-outs and contact-list impact
Review changes in opt-outs and other available list-health indicators.
A campaign that produces short-term engagement but causes a significant increase in unwanted communication signals may need a different approach.
Record the decision, not just the result
For every campaign, document:
- What the campaign was intended to achieve.
- Which audience received it.
- Which channel was used.
- The five relevant metric results.
- What the results suggest.
- What should be repeated, changed, or stopped.
This creates a useful history of campaign decisions and makes comparisons between weeks more meaningful.
Why Campaign Comparisons Need Consistent Definitions
One of the easiest ways to misread marketing performance is to compare two rates that were calculated differently.
For example, one campaign's response rate might use delivered messages as the denominator, while another uses the total number sent. Both may be labelled "response rate," but the results are not directly comparable.
The same problem can affect redemption and attendance reporting.
Before comparing campaigns, check:
The denominator: Is the rate based on messages sent, successfully delivered messages, or eligible recipients?
The action being counted: Does a response mean a reply, a click, a registration, or another tracked interaction?
The measurement window: How long after the campaign are attendance and redemptions counted?
The audience: Were the campaigns sent to similar player groups?
The campaign objective: Were both promotions trying to achieve the same outcome?
A consistent reporting definition makes trends more useful. Without it, operators may end up choosing campaigns based on numbers that cannot fairly be compared.
How JustKonnect Helps Bingo Operators Evaluate Campaign Performance
JustKonnect's Campaign Performance Dashboard is relevant to operators who want a clearer view of how their marketing communications perform.
The platform's wider Analytics feature describes reporting around campaign delivery, response, outcomes, new signups, visit-frequency trends, last-visit trends, offer redemptions, and contact-list engagement.
These reporting areas help operators connect different stages of campaign performance rather than relying on a single delivery or engagement number.
JustKonnect's wider platform also includes capabilities that can support campaign planning and evaluation:
- Customer Segmentation helps operators organise players into more relevant campaign audiences.
- Player Profiles & CRM provides context such as visit history, contact information, and loyalty status.
- Loyalty Points & Rewards supports reward-based engagement and offer participation.
- Exportable Reports supports sharing campaign and operational summaries.
The benefit is a more organised way to review what happened after a campaign and use the findings when planning the next one.
Operators should confirm the exact metrics, attribution options, and reporting functions available in their chosen configuration with JustKonnect.
Frequently Asked Questions
What campaign metrics should bingo halls track every week?
Start with delivery rate, response rate, attendance conversion, offer redemption rate, and opt-out rate. Together, they show whether messages reached players, generated interaction, were followed by attendance, led to reward usage, and affected communication preferences.
Is a high SMS delivery rate enough to prove a campaign was successful?
No. Delivery only indicates that messages were successfully delivered according to the provider's reporting. It does not establish that recipients read the message, engaged with it, or attended the promoted session. Operators should review response and attendance outcomes as well.
What is a good response rate for a bingo hall campaign?
There is no universal response-rate benchmark that applies to every bingo hall campaign. Results depend on the channel, audience, message, offer, and response definition. Operators should first establish a consistent measurement method and compare campaigns with similar objectives.
How can bingo halls measure whether a campaign generated additional attendance?
Track attendance among campaign recipients during a defined period. For a stronger estimate of incremental impact, compare the results with a suitable group of similar players who did not receive the campaign. This helps distinguish attendance associated with the campaign from visits that might have happened anyway.
Does a high offer redemption rate mean a promotion was profitable?
Not necessarily. Redemption shows that players used the offer, but it does not automatically show that the promotion generated additional visits or justified its cost. Operators should consider reward costs, attendance outcomes, and the campaign's original objective.
Why should bingo halls track opt-out rates?
Opt-outs indicate that some recipients no longer want marketing communications through a particular channel. Monitoring this measure helps operators identify potential issues with campaign frequency, audience relevance, and contact preferences. Opt-outs should always be respected.
How often should campaign performance be reviewed?
A weekly review is a practical starting point for recurring bingo hall promotions. Individual campaigns should also be reviewed after their relevant measurement periods have ended, particularly when attendance or redemption outcomes take time to become visible.
Stop Judging Campaigns by the Biggest Number
A campaign with the highest delivery rate is not necessarily the one that brought the most players into the hall. A promotion with the most redemptions is not automatically the most cost-effective. And a message that receives many replies may still need improvement if players are asking questions the original communication should have answered.
Each metric tells a different part of the story.
Delivery shows reach. Response shows interaction. Attendance conversion connects communication with visits. Redemption shows reward usage. Opt-outs reveal whether the audience wants to continue receiving messages.
When operators review these five measures consistently, they can make better-informed decisions about which campaigns deserve another run, which audiences need different messaging, and where communication needs improvement.
Explore the JustKonnect Campaign Performance Dashboard to see how campaign reporting can support a more measurable approach to bingo hall marketing.